Problem definition
Arts and culture is inherent in us all. Our realities have been shaped by the ongoing expression of reality with a variety of mediums and ways. We both practice the arts and culture and consume the arts and culture nearly every single day without realizing it. The arts and culture is natural to us all, but accessing it can be a challenge for many folks — depriving them of one of the most basic essentials of being human.
After work, someone wants to go to the art museum to relax. They want to see all the expressions of reality that our community has to offer. But what’s a simple drive or walk for some could be an impossible trek for others. Maybe they get out of work too late to travel to the museum and spend quality time there? Or perhaps the museum is only open when they work? Maybe getting to the museum takes too long, the admission fees are too high or the art at the museum doesn’t interest this person. And if these issues didn’t persist, then this person would be a regular attendee.
Another person feels listless in life. They wish there was something they could do each day beyond their normal responsibilities that’s fulfilling, but they’re unable to effectively pursue any interests due to a lack of awareness and education in the arts. If they had more arts classes when they were in school, perhaps they’d have a better idea that the arts could be a good hobby for them or they’d know that the arts could be an avenue where they find joy.
And then there’s folks who are trained in the arts, but they’ve fallen on hard times. It’s become nearly impossible for them to pay for supplies, but also find the time to create their art work. The result is that the community is deprived of their talents.
These are just a few scenarios that are playing out in the community, but they don’t have to be the reality.
All citizens should have unfettered access to the arts and culture as both participants who are contributing to the local arts and culture and consumers who purchase, visit and discuss the arts and culture surrounding them. Yet, access is weak on a variety of fronts, limiting the artistic and cultural potential this state could have. As the state cultural agency, it’s important to identify these barriers and commit resources to eliminating those barriers.
Context
There are a variety of data points that should be considered to help contextualize this problem. The best context would be to start with arts participation surveys that capture the participation and barriers to participation for both arts consumers and arts creators. It would be helpful to have historical data on this so that we can compare the past with the present. That would help us deeply understand where the community has been and is going, so we can make effective decisions.
We can then go forward and define the field by cataloguing where all arts organizations exist within the community. Arts organizations would be defined as both places that host arts activities or organizations that provide services supporting artistic development. Going deeper, we’d also asses the cost to engaging with these organizations and the cost to traveling to them, which would include time to get there from various neighborhoods, ease of access and public transit access.
Not having, understanding or acting upon this data will lead to a community that is devoid of cultural capital. There’s nothing creative happening or to engage with if barriers persist. This could have implications on attracting new residents, businesses and prospective students — the whole economic development spectrum, essentially. Resident happiness could be greatly effected too, due to these barriers to arts access, as well as resident growth levels from an economic perspective.
Hypothesis
The key hypothesis we’re testing through this project is as follows:
- If people had more opportunities to consume and create the arts in ways that fit within their lifestyle (e.g. the arts are low cost; the arts are nearby; they’re trained in the arts in some manner), then there will be an increase in arts participation — decreasing the main barriers to the arts.
Another hypothesis could be:
- If there are opportunities to participate in the arts, at a low cost, within each community in the state, then there will be no arts participation barriers.
Define the variables
We will measure arts and culture access on a variety of variables, including:
- Arts and culture venues and their locations, event attendance at each venue and frequency of attendance
- Surveys asking who identifies as an artist in the state and their output levels by hourly commitment or product (whichever output the artist prefers to provide or measures their output by)
- A map of where arts venues exist and their proximity to target audiences
- Ease of transportation access (highway traffic, parking availability, public transit access)
- Cost of entry to arts venues and cost of entry into practicing arts
- Frequency of arts events in the community
- Cost of arts education in the community (both practice-based education and appreciation-based)
- Arts and culture education levels
- Awareness of arts and culture programming and education opportunities among the community
- Surveys that illustrate ways in which practicing artists lack resources to pursue the arts
- Surveys about general barriers to attending arts and culture events
- Number of folks applying to attend arts education and number of available seats available for artist students
- A survey of programs that exist where folks can participate in the arts
- Survey that identifies what folks in the state want from the arts and want to do within the arts, whether that’s participation or consumption.
When then want to always collect demographic data, including:
- Race, ethnicity and gender
- Income level
- Education level
- Career industry
- Access to personal and public transportation
- Location of job and home
Collecting, analyzing and understanding the trends within the above data will help us understand what resources to use to help address access barriers. For instance, we may notice that certain communities don’t have arts events or venues within their community. The people could be surveyed and found that they want more arts and culture events, so we can start hosting more events in those areas with events they want.
Also, understanding who doesn’t engage with the arts, at broad levels, while creating causal links between that their arts education levels and income levels could help us direct funding that supports arts opportunities — while solving for challenges to attending said opportunities — for both children (to create a pipeline of folks who have less barriers) and for adults (to get them to start participating in the arts in general).
With the objective of creating equitable access where there are no barriers, finding demographic-based disparities in participation will be vital, as well as location-based deficits. It will also be crucial to understand how folks want to engage with the arts and ways in which they’re unable to engage with their identified arts medium.
Important trends to understand would be if people who work or live in a certain community participate in the arts the most — this would give us an idea as to what’s already successful and how we can mimic those communities in underserved locations.
We could also find that only certain people within a certain income bracket or education level are participating. Any disparities that show arts participation, both actual and desired, when compared with community demographics will help us see who isn’t being served and who is being over-served — showcasing both resource deficits and surpluses.
Data collection methods & measurements
We would primarily measure all the variables mentioned above through community surveys. We could send folks door to door, send mailers and also have people on the ground at both events, public transit spaces and community hubs (e.g. grocery stores) to gather all this data. These methods would help us understand art consumers and their relationship to barriers as well as art creators.
Then, to dive deeper, we would have interviews to get more opinions about the data and to start illustrating stories about specific barriers – helping us develop how we can overcome said barriers.
Results
The types of results that would be most interesting would be community identified barriers that we could immediately address. Folks could mention that the buses don’t take them to venues or parking at venues is too difficult. Or they could mention the price and cost to get art supplies — even including details on the difficulty of finding the art supplies within the community.
As noted previously, when/if we see that the arts is too expensive we could start to subsidize the arts in various ways. Or maybe there aren’t enough education or awareness levels of the arts? We can then provide funding for education as well as programs that increase awareness. Then, we could also find geography-based barriers, so we can then either start new programs or make transportation easier.
Going beyond community identified issues, the data would also start showing us other issues the community isn’t necessarily aware of, but that we’re able to identify. This would primarily be causal, demographic-based links and arts engagement. An example would be that people who attended college participate in the arts the most, so then we can then create programs that entice non-college educated folks into arts participation in a way that they’re willing and able to participate.
Limitations
Since the problem definition and the idea of eliminating all barriers to accessing the arts is so broad, I see that as the biggest limitation. Additionally, it would be impossible to address every single barrier imaginable, as there just aren’t enough practical resources in the world to make that happen. It would also be difficult to get people to self-identify all their barriers to arts participation, as we could easily capture recent experiences that don’t fully illustrate potential systemic challenges that need addressing. Then the demographics we survey could also be too narrow or include a lot of double-counting. Also, this is a significant amount of community data, which will take time to collect and effectively analyze in a timely manner before it becomes irrelevant.
Prioritize
The biggest priorities I would make would be data around location, attendance/creation levels and income levels. This would help us see how accessible from a physical and monetary level the arts are in the state. From there, we can begin to make it easier for folks to attend the arts by making it more affordable and easy to attend (ride shares, more walkable streets/environments, etc). It would also be simple to collect this data through surveys as well, and affordable. But if it isn’t affordable to collect all these data points, then we could just look at arts attendance and compare that with where they are based. From there, we can see if we can model those arts events across the state.
Data dashboard
Here are 10 visualizations that we’ll use to pursue this project:
Map of art venues in community (Artlink Art Detour 25):

Map of public transit lines in the community with overlay of arts venue distribution (hypothetical):
Graph of people’s proximity to the arts venues and their willingness to attend (hypothetical data):

Pie chart of types of arts people in the community consumed (hypothetical data):

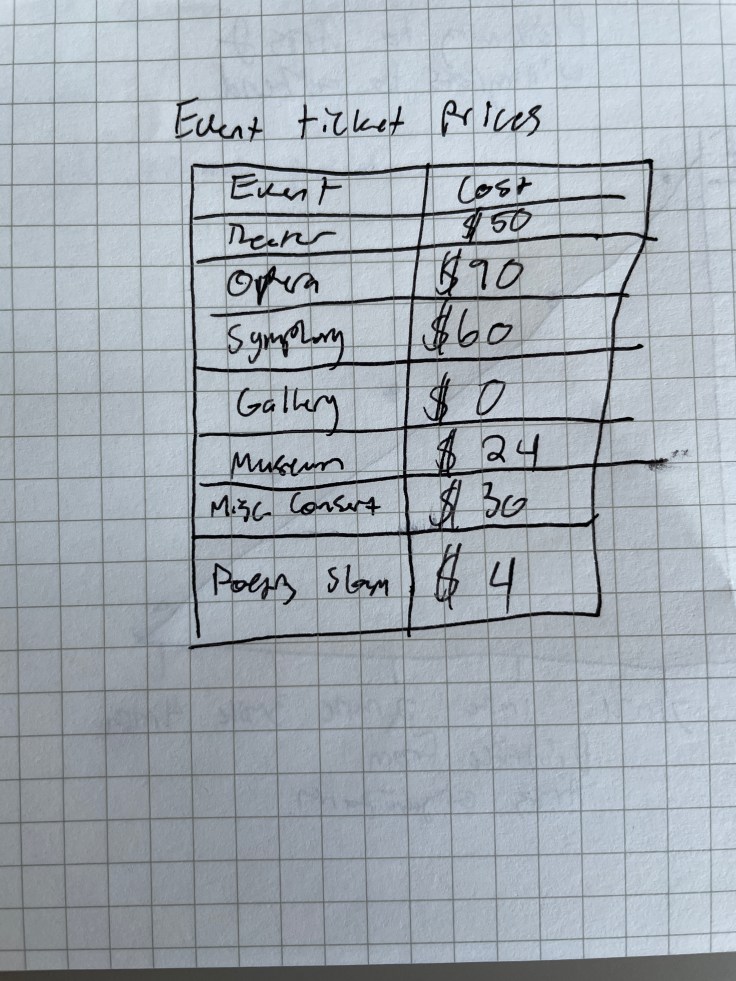
Table of ticket prices to arts events (hypothetical data):
Bar graph of cost of entry to different arts practices (hypothetical data):

Pie chart of art practice distribution (hypothetical):
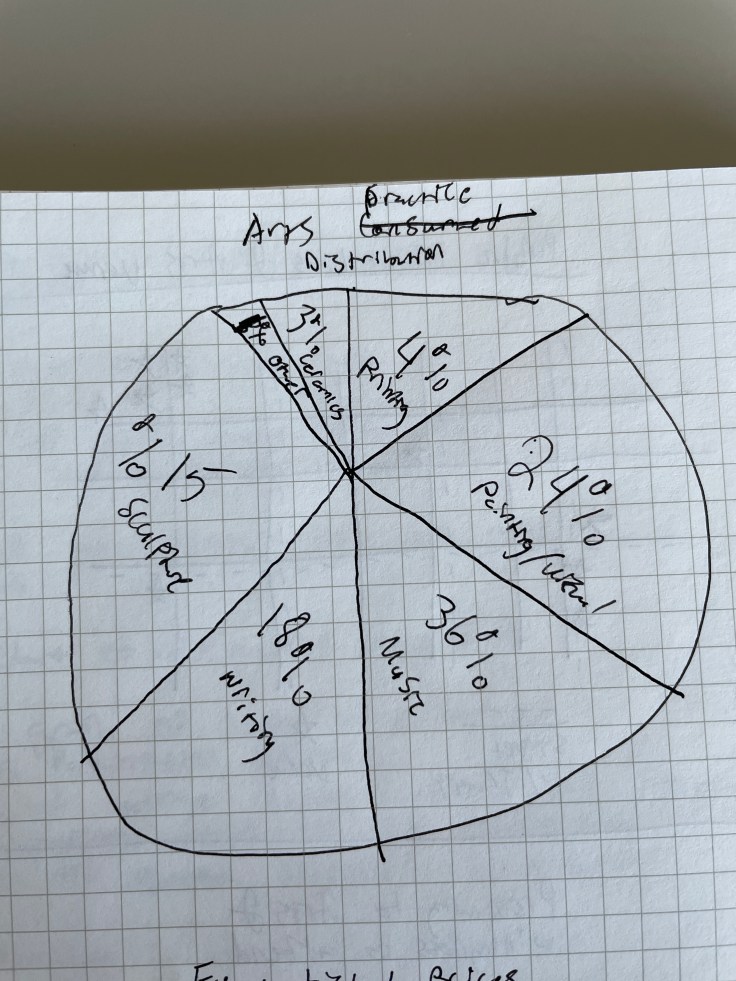
Table of arts participation score* and income level (hypothetical):
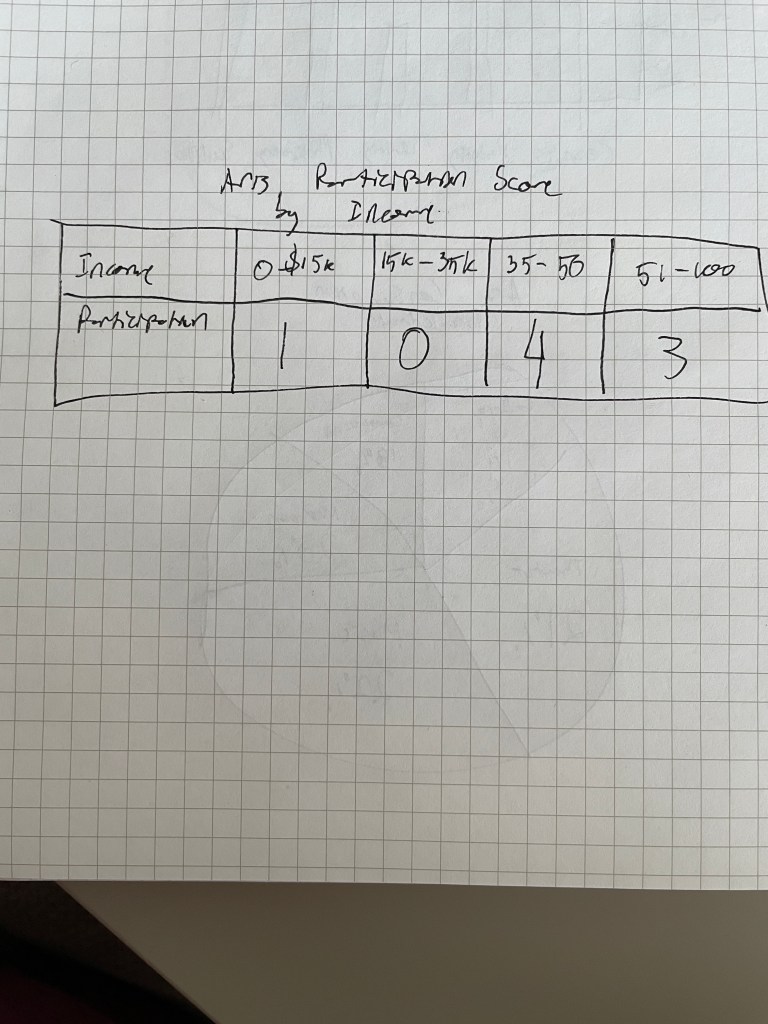
Table of arts participation score and age (hypothetical):

Time people can spend on the arts by age group (hourly each week) (hypothetical):

*The arts participation score is fictional metric that measures how much art someone consumes or produces matched with their desired consumption or creation — which is measured in hours. That is then compared with the amount of hours of art participation they want. The score is based on a 0 to 4 measurement with 0 the lowest and 4 the highest.

Leave a comment